Representative Research Publications
Diverse structural conversion and aggregation pathways of Alzheimerʼs amyloid-β (1-40) 2019 > Representative Research Publications > Research Results Home
Diverse structural conversion and aggregation pathways of Alzheimerʼs amyloid-β (1-40)
- ACS NANO / July 2019
- Yuxi Lin (first author), Young-Ho Lee (corresponding author) Yang Hoon Huh, Eunyoung Moon, Jae Hyuck Jang, Kyoung-Seok Ryu, Jeong Kyu Bang (co-authors)
Study Summary
Complex amyloid aggregation of amyloid-β (1-40) (Aβ1-40) in terms of monomer structures has not been fully understood. Herein, we report the microscopic mechanism and pathways of Aβ1-40 aggregation with macroscopic viewpoints by tuning its initial structure and solubility. Partial helical structures of Aβ1-40 induced by low solvent polarity accelerated cytotoxic Aβ1-40 amyloid fibrillation while predominantly helical folds did not aggregate. Changes in the solvent polarity caused a rapid formation of b-structure-rich protofibrils or oligomers via aggregation-prone helical structures. Modulation of the pH and salt concentration transformed oligomers to protofibrils, which proceeded to amyloid formation. We reveal diverse molecular mechanisms underlying Aβ1-40 aggregation with conceptual energy diagrams and propose that aggregation-prone partial helical structures are key to inducing amyloidogenesis. We demonstrate that context-dependent protein aggregation is comprehensively understood using the macroscopic phase diagram, which provides general insights into differentiation of amyloid formation and phase separation from unfolded and folded structures.
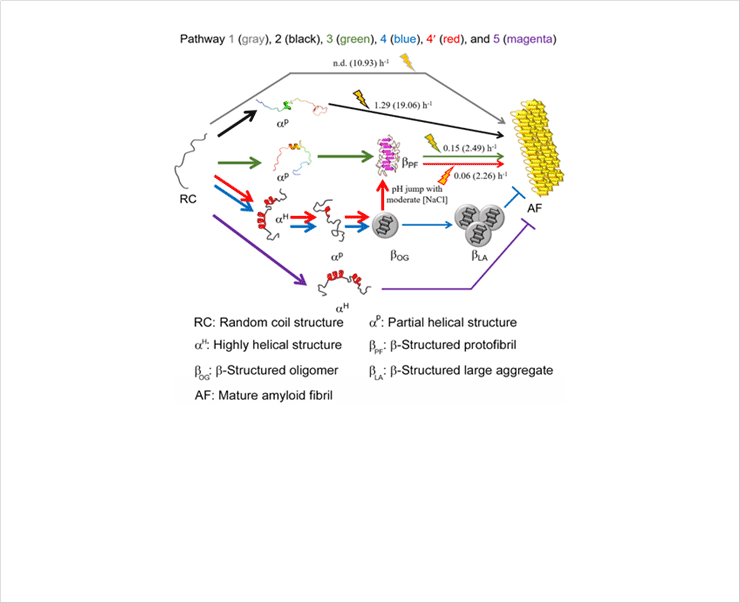 Figure 8. A scheme of the microscopic aggregation pathway of Aβ1-40. Various aggregation pathways are shown and guided by arrowed curves in distinct colors: pathway 1 (gray), pathway 2 (black), pathway 3 (green), pathway 4 (blue), pathway 4′ (red), and pathway 5 (magenta). aP in the pathway 2 and 3 obtained from MD simulations was used. aP in the pathway 4 and 4′ and aH in the pathway 4, 4′, and 5 were conceptually drawn. aP in the pathway 3, 4, and 4′ is too transient to be detected using general experimental tools used here. The markedly rapid reactions of which kinetic parameters could not be obtained are represented using bold arrowed curves. The reactions accelerated by sonication are highlighted with cartoons. Kinetic parameters (i.e., the rate constant of fibril growth and conversion) in the absence and presence (values in parentheses) of sonication are shown.
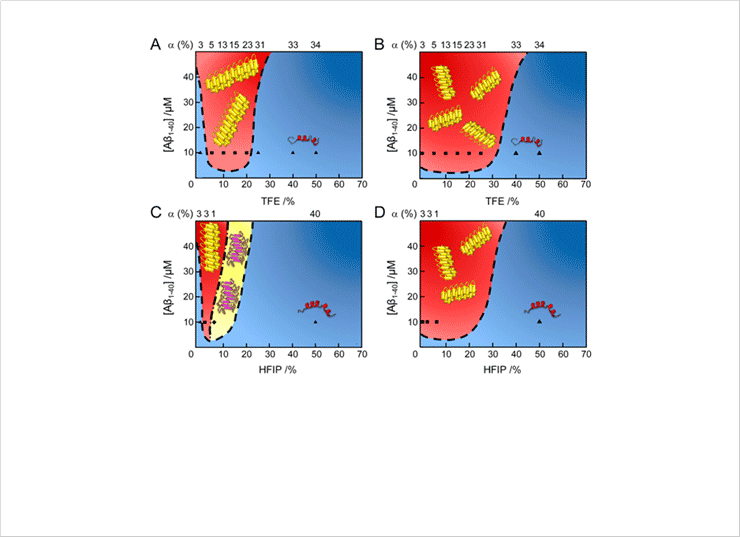 Figure 1. Macroscopic phase diagrams of Aβ1-40 aggregation in water/alcohol mixtures. (A-D) Phase diagrams of Aβ1-40 in the (A and C) absence and (B and D) presence of sonication. Cartoons of helical monomers, amyloid fibrils, and protofibrils are illustrated. Colors and symbols represent molecular species: (blue region) soluble monomers; (red region) mature amyloid fibrils; (yellow region) protofibrils. Each symbol indicates the concentration of Aβ1-40 and alcohol used. The α-helical contents of the initial states of Aβ1-40 before aggregation, are displayed at the top of the phase diagrams. Aβ1-40 aggregation in the presence of 100 mM NaCl at pH 7.5 with (A and B) TFE and (C and D) HFIP.
Expected Effects
Current finding on the microscopic molecular mechanisms of Aβ1-40 aggregation under varying conditions along with macroscopic phase diagrams will be of significant importance for controlling of amyloidogenesis of Aβ peptides and related proteophathy as well as for developing of effective therapeutic modalities.